The Feending MethodGuide 6
Analysis: measuring to evolve (without drowning in metrics)
8 min read
Analysis is the fifth block of the Feending Method: measuring what works, what doesn't and what needs to change, so you return to Ideation with data. What is not measured is not improved. It is done with four indicators — active members, member-initiated activity, recurrence and new connections — and not with email opens, attendees or followers, which measure how many people listen to you, not whether the community is alive.
Every quarter the report comes round. You open the email tool: 38% open rate. You open the events sheet: 120 attendees at the last one. You open LinkedIn: 1,400 followers, 60 more than last quarter. You paste it all into a deck with three green charts and send it.
And nobody, yourself included, knows whether the community is better or worse than a year ago. All three numbers are real and all three are useless for the question that matters. And since they are the only numbers to hand, they are what ends up being optimised: more emails, more events, more followers. More noise.
The analysis block of the Feending Method closes the wheel: it is where you check whether ideation was fulfilled, whether communication landed, whether engagement activated and whether monetisation sustains. The community evolves, and you with it — but only if you look.
What is engagement in a professional community?
It is the share of members who take part actively — they do something, rather than just receive — and repeatedly — more than once, not only on the day of the event.
By that definition, an email open doesn't count. Attending an event half counts: it is active but one-off. Answering another member, joining a group, introducing two people, posting an opportunity: that counts in full. Which is why you need different indicators. Not more of them: different ones. If you are not yet sure what separates a community from an audience, start with the first guide in the Communities module.
Which four indicators actually measure engagement?
Active members over the total, member-initiated activity, recurrence and new connections. All four fit on one page and get reviewed once a quarter.
1. Active members over total members
Of everyone in your base, how many have done anything in the last 90 days? Logged in, replied, signed up, written. Divide by the total and you have your activity rate.
It is the most honest indicator there is, which is why it is the least popular: in most professional communities that start measuring it, it sits between 5% and 15%. That is fine. The starting number doesn't matter. What matters is that it goes up.
2. Member-initiated activity
Of all the activity in the period, how much was started by a member rather than by the organisation? A question in a group, a proposed event, a posted opportunity, an introduction between two people.
This is the one that separates an audience from a community. If 95% of what happens is started by you, you have a broadcast channel with a good response rate. When that figure drops below 70%, something has genuinely changed: the community has started working without you.
3. Recurrence
Of the active members, how many were also active in the previous period? An event with 120 attendees where 100 are new each time is not building anything: it is recruiting. An event with 60 attendees where 45 come back is building a habit.
Recurrence is what turns participation into belonging. And it is the indicator that gives the earliest warning: it drops one or two periods before attendance does.
4. New connections between members
How many relationships between members that did not exist before has the community produced this period? Two people who meet at an event and message each other afterwards. A mentor and a mentee. A member who hires another.
It is the hardest to measure and the most valuable, because it is the only one that directly measures what the community exists for. If you can't measure it, at least ask: a two-question survey once a year ("have you met someone useful through the community?", "who?") already tells you more than any open rate. And if your platform records connections — in Feending the connection module does — the number comes out on its own.
How do you read these indicators without fooling yourself?
By looking at trends rather than snapshots, separating the active core from the rest, and choosing each indicator knowing what behaviour it drives.
Look at trends, not snapshots. 12% active members means nothing. 12% that was 8% a year ago means a lot. Always compare with the previous period and with the same period last year, because communities have seasons.
Separate the core from the rest. Every community has a 5% that does everything. Take them out of the count: if the numbers still look reasonable, the community is healthy. If nothing is left without them, you have a group of volunteers, not a community.
Don't reward what you can inflate. If the goal is "more events", there will be more events with fewer people at each. If the goal is "more recurrence", there will be fewer, better events. Choose the indicator knowing what behaviour it drives.
What metrics does the platform offer for analysis?
Periodic reports with the state of the community in real time: activity inside the platform, participation in events, demographic data, growth in sign-ups, matches created, meetings arranged and the interaction ratio between users, plus a ranking of the most active members. All exportable to PDF or CSV.
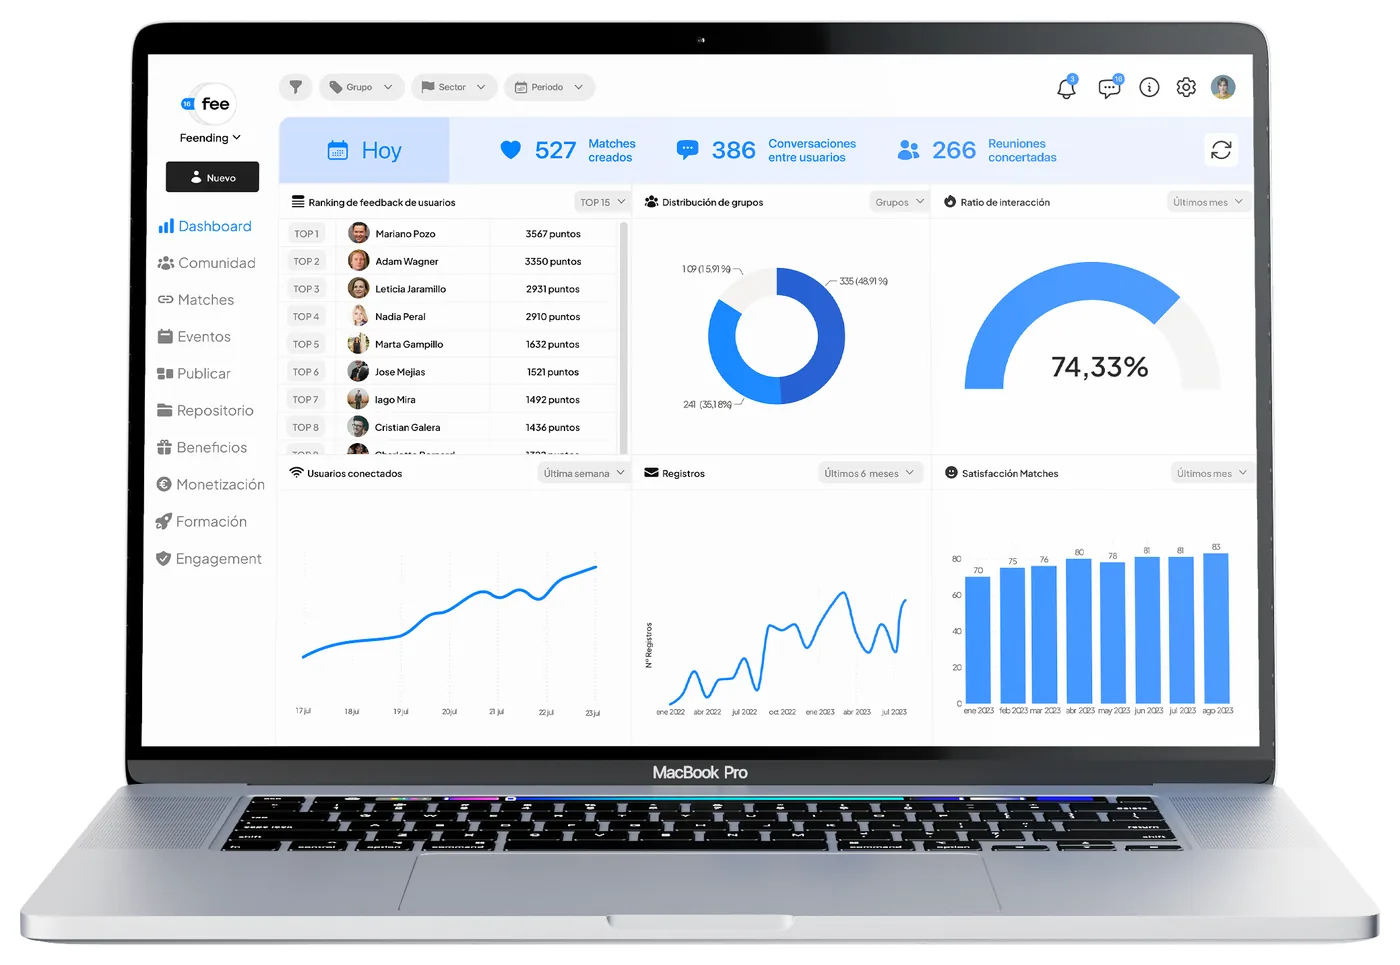
With Excel, email and WhatsApp the four indicators above cannot be calculated: there is nowhere they get recorded. Feending's analytics produce them on their own because all the activity — who logs in, who takes part, who connects with whom, which mentorships, jobs or investments get generated — passes through the same place. Reviewing those reports once a quarter, with the question "what do I change on the next turn", is the whole block.
What do you do when engagement drops?
First identify which of the four indicators has dropped, because each one points to a different cause — and don't respond by communicating more: more messages to people who have already stopped taking part is what made them stop.
- Total activity drops: there is probably nowhere to take part. Check whether, between one event and the next, there is a space where anything happens.
- Member-initiated activity drops: they have got used to you doing everything. Stop proposing things yourself and ask three specific members to propose instead.
- Recurrence drops: what you offer doesn't change. Whoever already came knows what they will find and doesn't come back. Vary the format, not the frequency.
- Connections drop: your spaces are for listening, not for meeting. A 90-minute event with 80 minutes of talks and 10 of coffee produces zero connections.
Four numbers, a one-page dashboard, one review a quarter. That is how you run a community. Everything else is reporting. If you want to translate it into euros, continue with how to calculate the return of a well-run community.
And after the analysis?
Round again: with what the data says you revisit ideation — which value proposition is genuinely being delivered, which goals to adjust — and take the next turn of the wheel. Every turn you do it better.
That is the logic of the method: not a list that gets finished, but a cycle of continuous improvement. A community is not built in a day; with a clear process, powerful tools and a firm purpose, it is built turn by turn. And if yours hasn't taken the first one yet, the first-steps guide is the place to start.
Frequently asked questions
What is a good active-member rate in a professional community?
Between 5% and 15% is typical when you start measuring; above 25% in 90 days is a very healthy community. More than the number, what matters is that it rises quarter on quarter.
Does the newsletter open rate measure engagement?
No. It measures how many people read you, which is an audience metric. Engagement is measured by what members do — take part, propose, connect — and above all by what they do with each other.
How often should engagement indicators be reviewed?
Once a quarter, comparing with the previous quarter and with the same quarter last year. Reviewing them weekly produces noise: professional communities move by season, not by day.
What tool do you need to measure engagement?
One where member activity is recorded: who logs in, who takes part, who connects with whom. With email and spreadsheets you can only measure broadcast; a community management platform with analytics produces the four indicators without manual work.
Want to see how it applies to your community?
Tell us what your community looks like and we will show you how similar ones do it with Feending.